In this post we would like to demonstrate how to use our social media analytics combined with our advanced technical analysis on the example of Particl.
Particl had a surge in sentiment and tweets mentions around a week ago. See our tweet from that time:
twitter.com/bittsanalytics/status/969388576575279105
By looking at the hourly data we can see sentiment and mentions surged on 28th February 8pm UTC time when the price of Particl was around 20.8 USD.
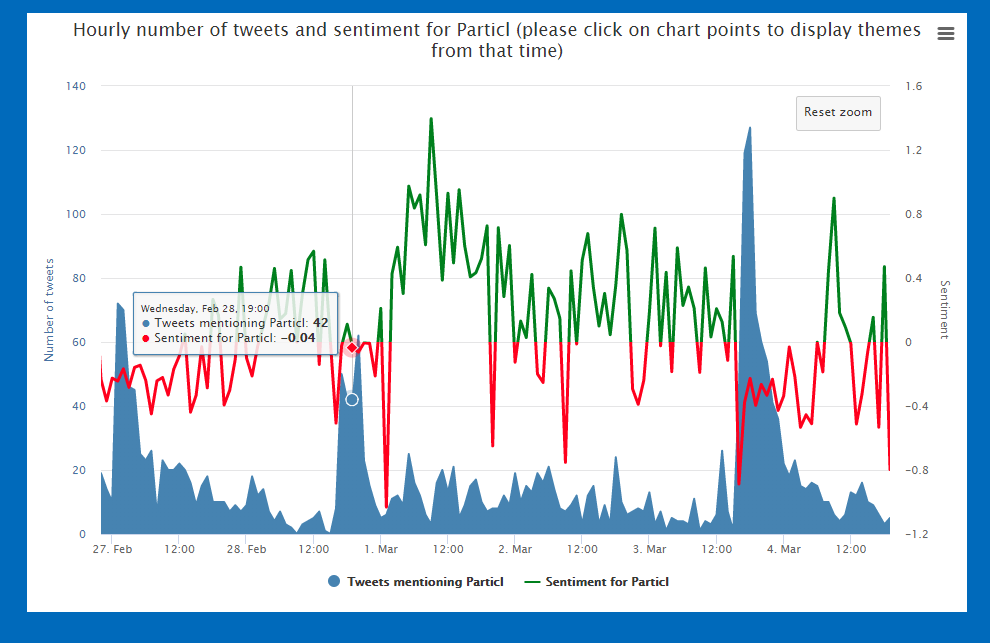 While the sentiment somewhat receded this was followed later by another surge in tweets mentions on 3rd March. Social media momentum was strong.
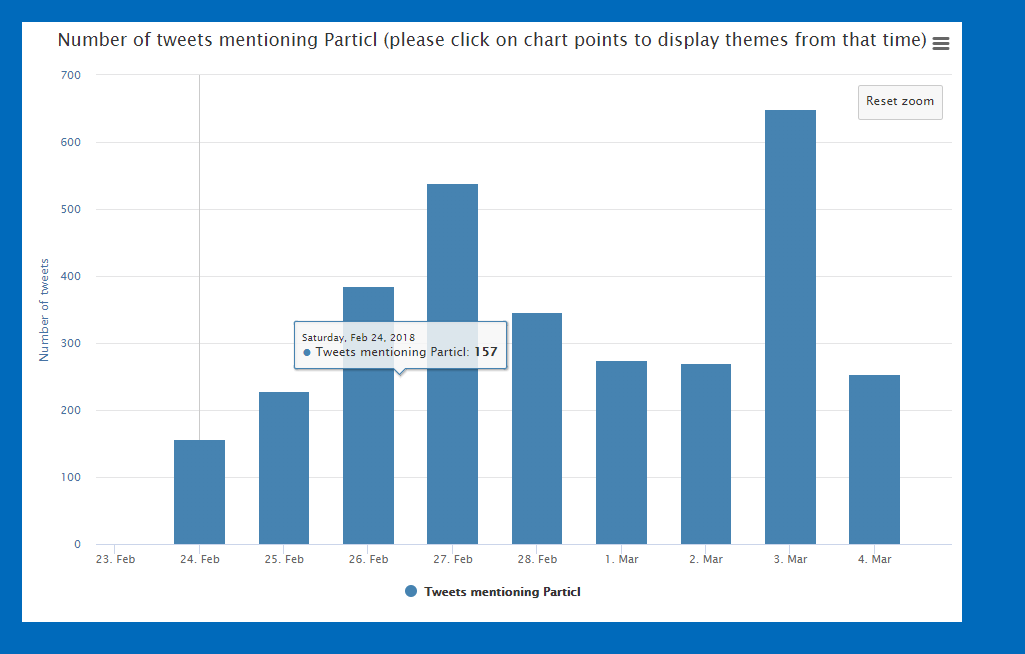
If we now look at the bands provided by our platform:
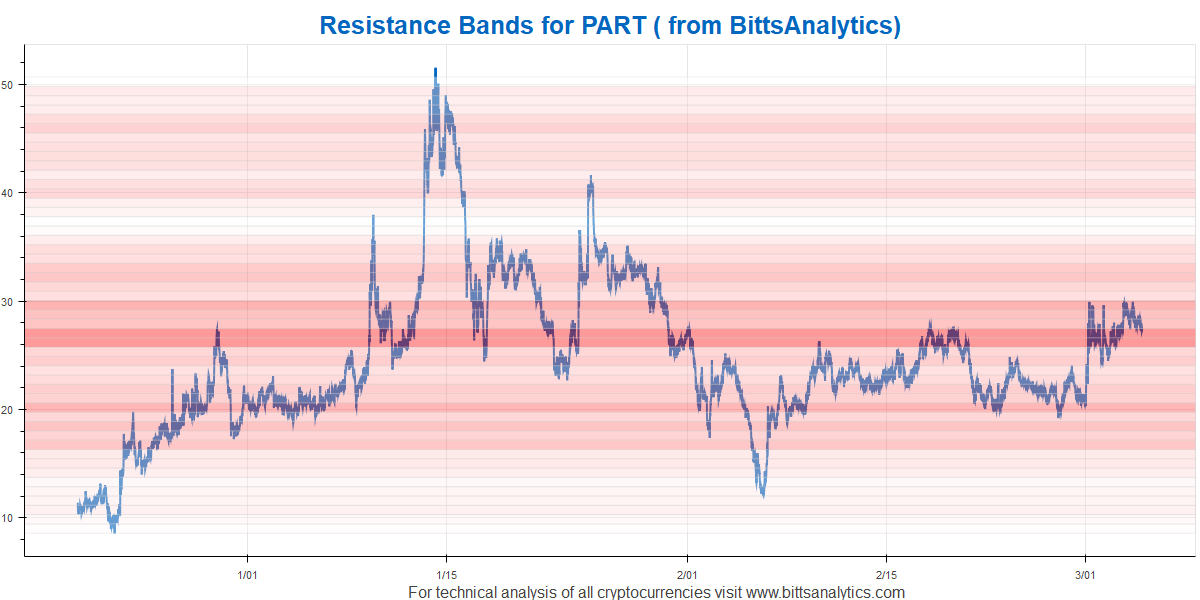
you can see 1) weak or white band between 30 USD and 32 USD. 2) stronger resistance band above 32 USD. From our bands we would expect a rapid rise from 30 USD to 32 USD and then consolidation or fall back to lower levels. One trading way in addition to original long position is to put a limit buy order at 30 USD and limit sell order at 32 USD. And this is indeed what happened regarding the band 30-32 eventually confirming again the valuable insight from our BittsBands (you can also see how fast was the increase from 21 to 26 USD where the resistance bands were very weak) . See updated chart below:
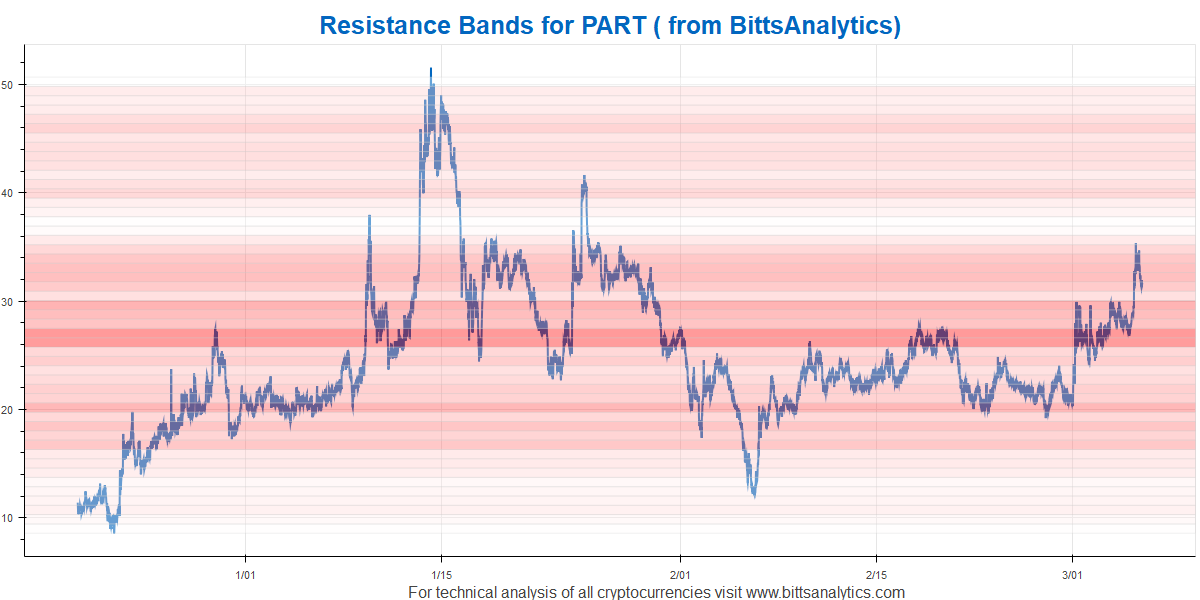
Total return from original levels around 70%.
If you want to start using our platform subscribe at www.bittsanalytics.com.