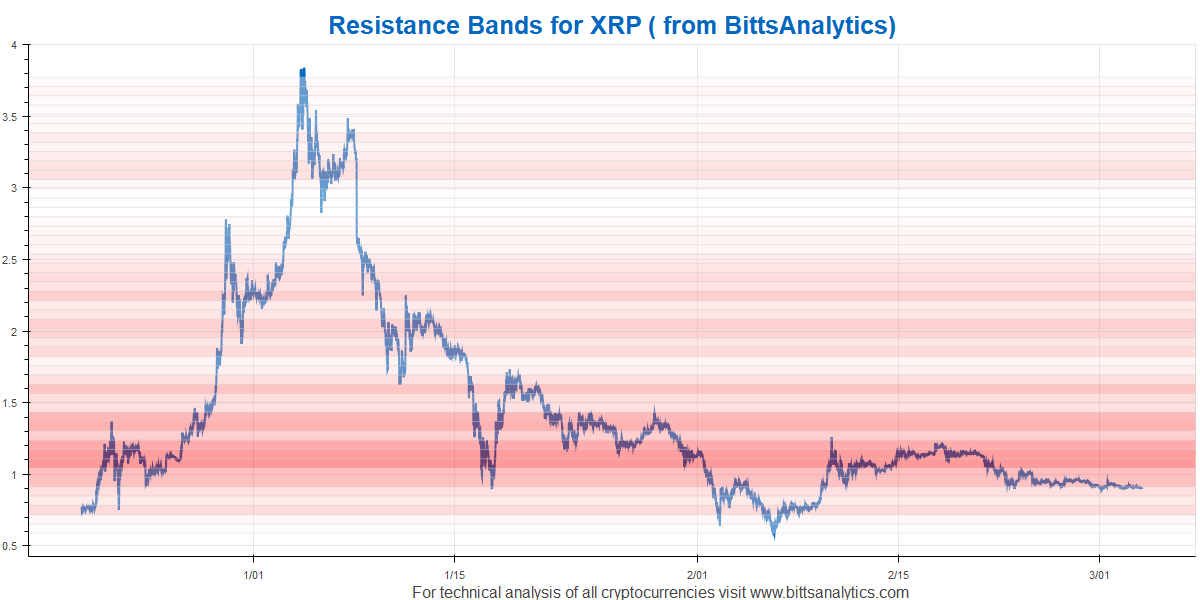
In this post we would like to introduce the use of our recently introduced advanced feature, Bands or BittsBands, on a concrete example. We are using deep learning on vast sets of different data to assess where could be possible price bands of resistance for cryptocurrencies, see e.g. bands for Ripple below. The more red the particular band is, the higher is the probability that the price will rebound from it when falling towards the band or that it will fall, “repelled” by the band when increasing and encountering the band from below. If the band is particularly weak, i.e. almost white, then there is a higher probability of price rapidly moving through such price band. Of course not every price movement will follow this pattern as often there are other drivers, such as a very positive news, where the price can rise or fall through such bands. But it can often work surprisingly well.
As an example of use, yesterday we mentioned in a tweet (see below) about Ripple that it would be interesting to see what happens when Ripple reached the rather strong resistance band from 1.05 USD to 1.2 USD:
twitter.com/bittsanalytics/status/970466555074174976
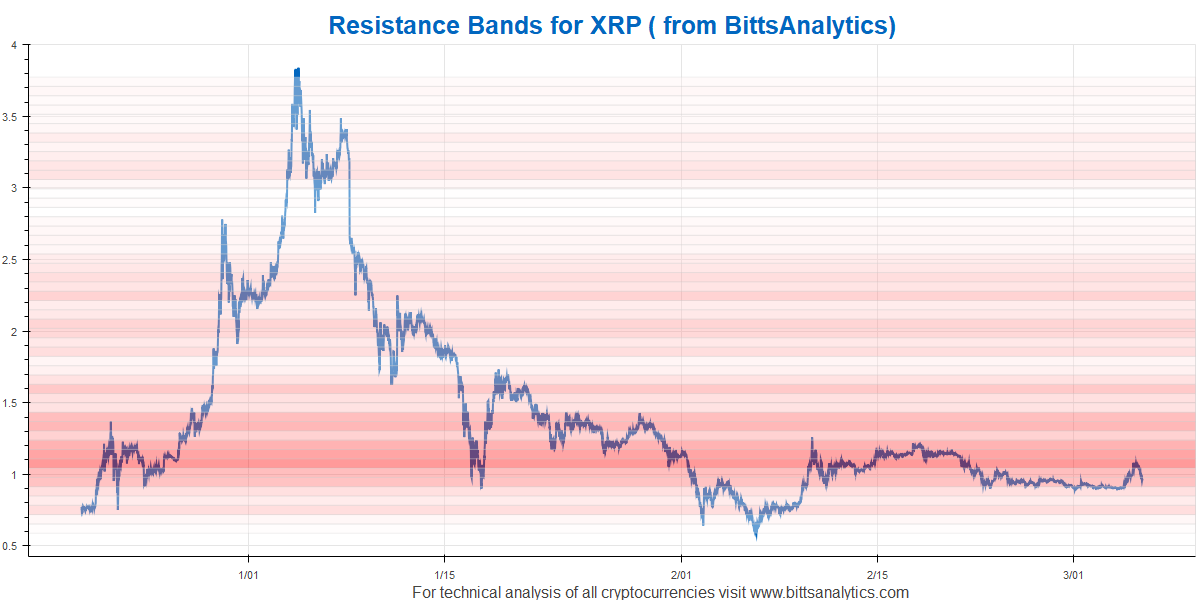
And after the tweet the price first rose to the band, reached around 1.08 and then indeed fell back to 0.96 USD at the time of writing this post. See the updated chart below:
If you want to start using our BittsBands and many other advanced analytics you can by subscribing at www.bittsanalytics.com. For other examples of using BittsBands see our post about Particl:
or see our recent tweet about Ethereum Classic below where we analysed that due to weak resistance bands below 32 USD it can fall rapidly below 30 USD and this is indeed what happened, it is now around 25 USD.
$ETC broke through bottom support recently. will be interesting to see how this one develops. also enclosed resistance bands for ETC. weak support below 32 USD. get automated detection of chart patterns with artificial intelligence at https://t.co/7qZ4X0cz6s pic.twitter.com/43hrMatgRX
— Bittsanalytics (@bittsanalytics) March 4, 2018