In this post we would like to show how to use our two recently introduced features on our BittsAnalytics platform – automated detection of chart patterns and BittsBands – price resistance bands based on advanced analysis of vast amounts of data.
In a recent tweet:
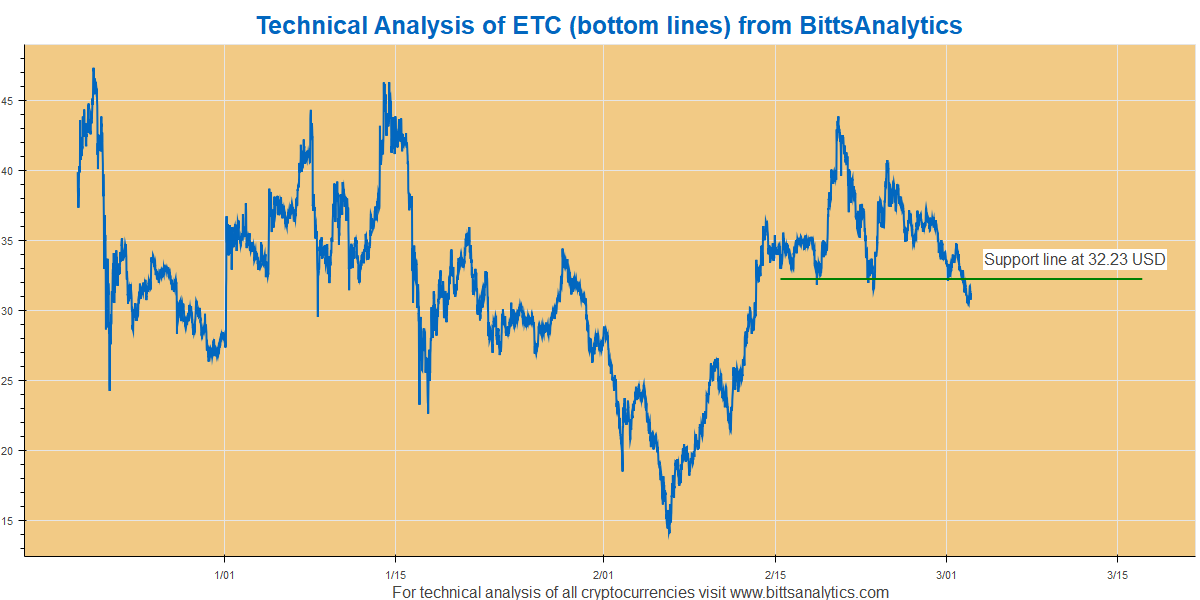
$ETC broke through bottom support recently. will be interesting to see how this one develops. also enclosed resistance bands for ETC. weak support below 32 USD. get automated detection of chart patterns with artificial intelligence at https://t.co/7qZ4X0cz6s pic.twitter.com/43hrMatgRX
— Bittsanalytics (@bittsanalytics) March 4, 2018
we mentioned that the Ethereum Classic just broke through bottom pattern support and there are no strong resistance bands below 32 USD. This means a higher probability that the price will continue to fall. See both pictures below.
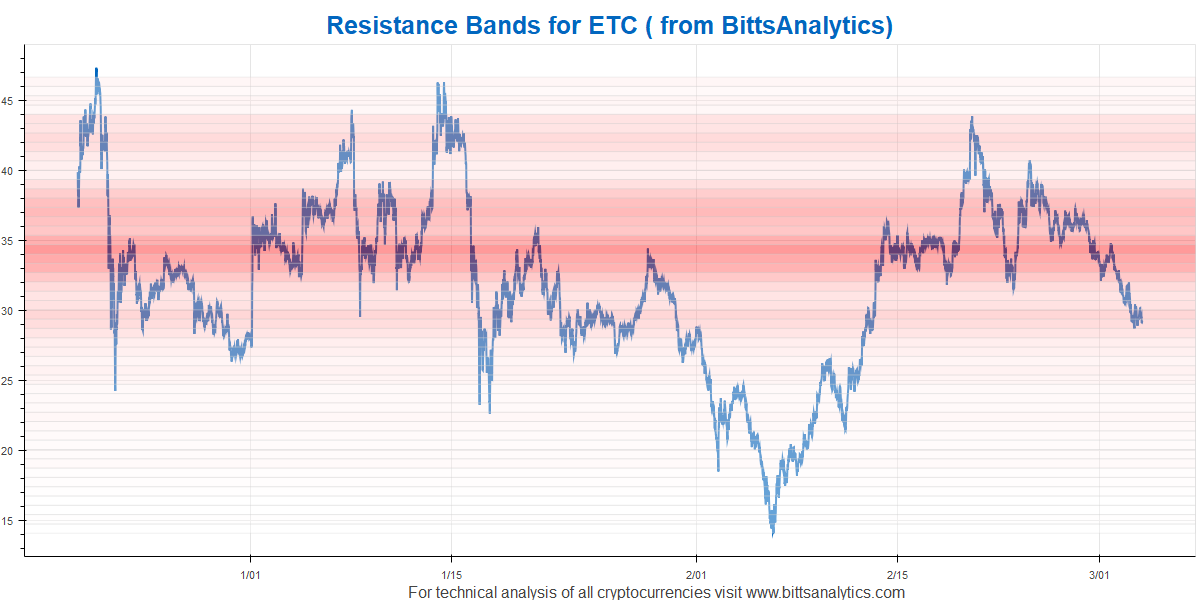 This is indeed what happened afterwards with price of Ethereum Classic falling through the very weak bands to 25.18 USD as of writing this post. This is another example of combining advanced technical analysis with resistance band to analyse potential future price movements of cryptocurrencies. If you want to improve your cryptocurrency trading with these analytics tools and many other, subscribe at www.bittsanalytics.com.