We are using proprietary deep learning on vast sets of different data to assess where could be possible price bands of resistance for cryptocurrencies. For many excellent past cases of achieving high returns with BittsBands see our blog posts at http://www.bittsanalytics.com/blog/category/bittsbands/
Golem on 2nd May entered price region where it had almost no resistance BittsBands just above 0.6 USD:
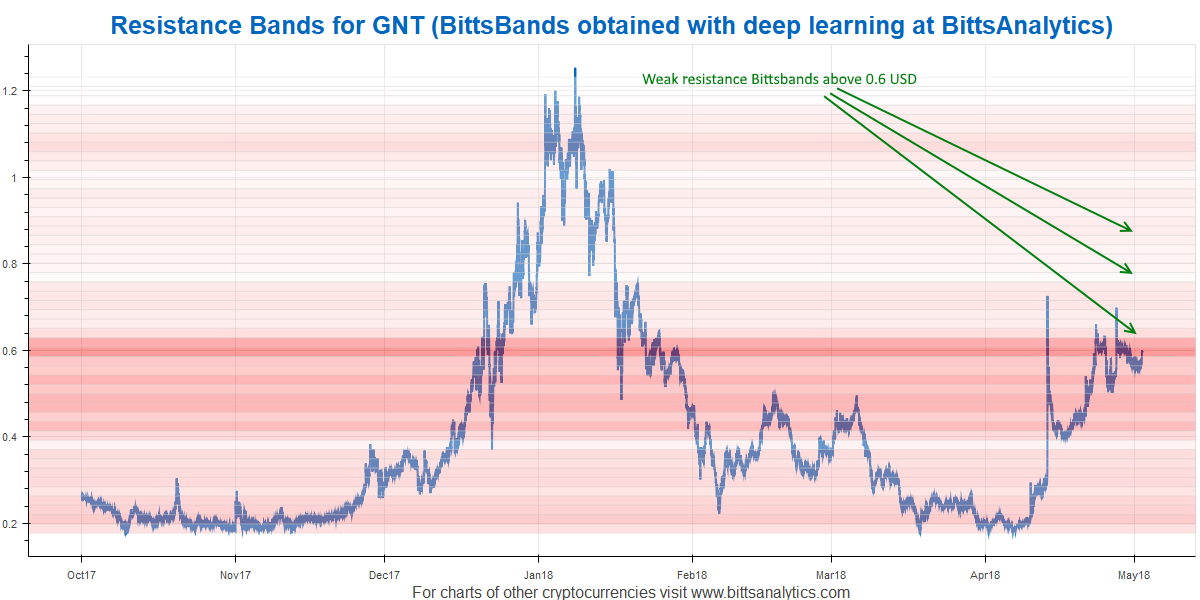
In this situation a rally through 0.6 USD to much higher values would have a higher probability. This is indeed what has happened in the last day with the price now reaching 0.91 USD for a return of 48% in just a day.
If you want to include deep learned Bittsbands data in your cryptocurrency analysis you can find it at our BittsAnalytics platform: www.bittsanalytics.com. Platform also has a lot of other advanced data such as social media analytics and chart patterns automatically detected with AI as well as sophisticated analytical tools. These have also proven excellent generators of trading signals, read more about them here: http://www.bittsanalytics.com/blog/category/bittssignals/