BittsAnalytics provides its users with a wide array of Big Data and advanced analytical tools to produce market timing and trading signals. Trading signals from BittsAnalytics can be based on:
- sentiment analytics of social media posts (we use machine learning for sentiment classification)
- social media mentions analytics
- price resistance bands, BittsBands, obtained with deep learning
- technical analysis of chart patterns (we have automated detection of chart patterns with sophisticated machine learning algorithms)
In this blog post we would like to show how even technical analysis works surprisingly well in identifying turning points. See the chart of double and triple top patterns for Bitcoin (the chart was automatically generated by our AI which does it every day for all cryptocurrencies):
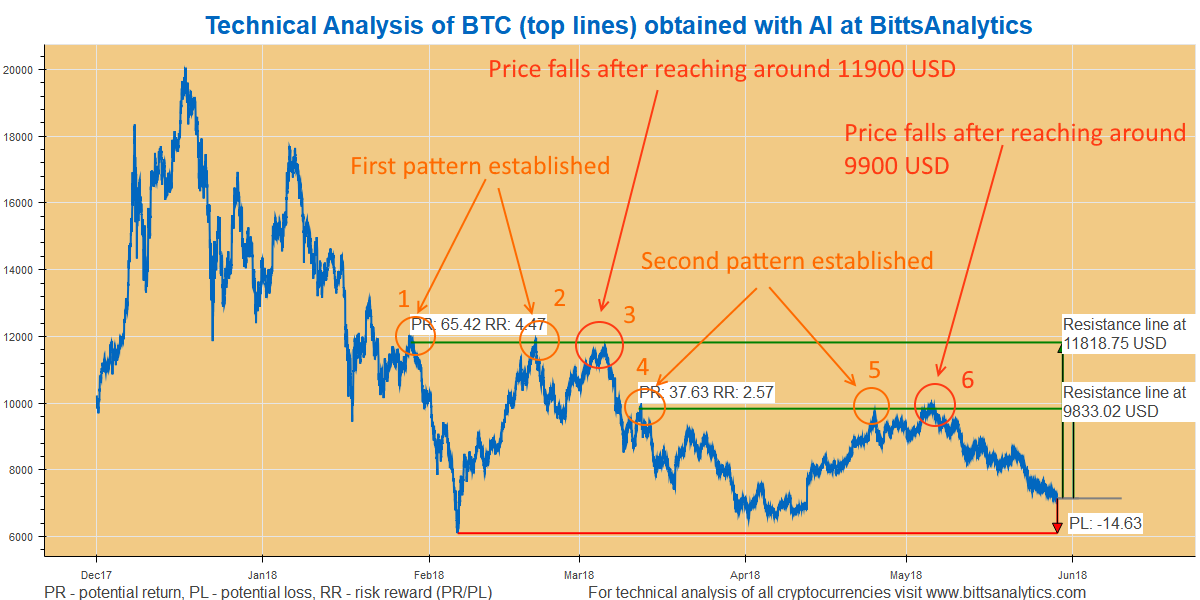
As you can note there were two cases where the Bitcoin established a top pattern and then fell on that top line. First the pattern was established by points 1 and 2 at around 11900 USD. Bitcoin then fell after reaching the level for the third time (point 3). More recently the next top pattern was established with points 4 and 5. And after reaching this level of around 9900 USD (point 6) the Bitcoin again fell and has been down almost 30% since that price.
Top and bottom patterns can thus be a very useful tool for assessing the potential of cryptocurrencies for rise or fall in price. We automatically generate chart patterns like this every day with our AI algorithms and make them available at our platform. You can subscribe at our platform here: https://www.bittsanalytics.com/subscribe.php